Kimberly Montero Shows How Faster Analytics Can Expose Maternity Care Gaps
At HealthDataCon 2026, Kimberly Montero explained how clinician-led analytics helped uncover a language-access gap, guide a rapid response and connect maternity quality improvement with community support.
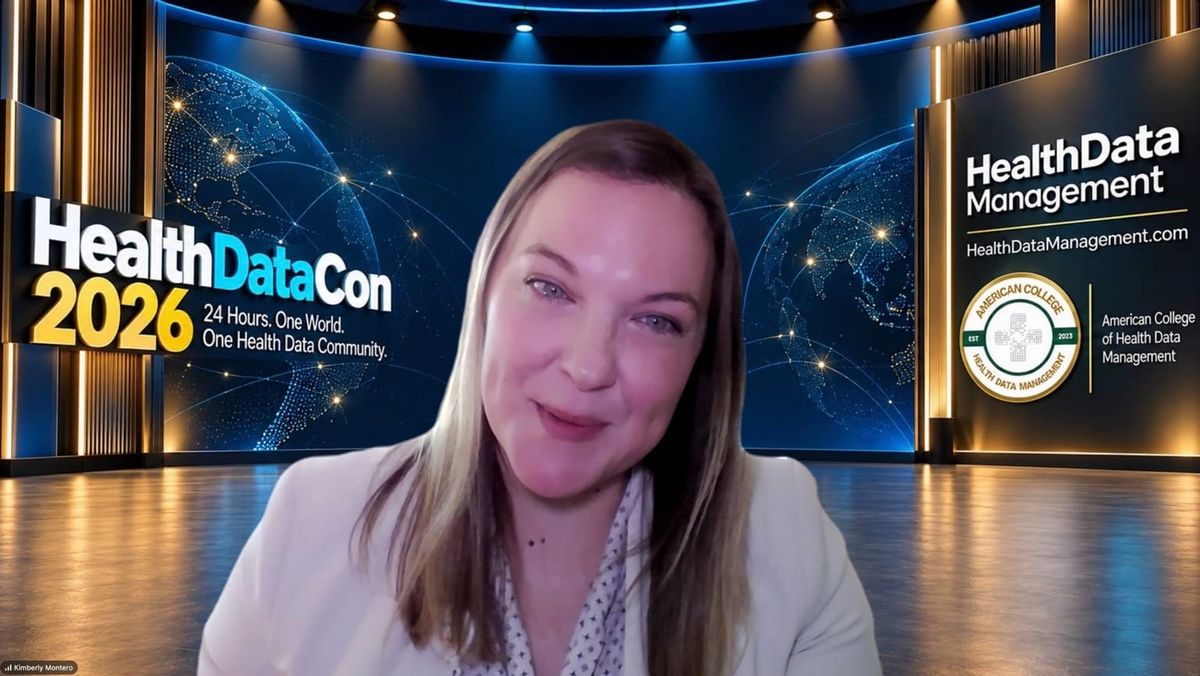
Hartford HealthCare clinicians used a maternity dashboard to identify a language-access problem affecting Haitian-speaking families and put a targeted response in place within two weeks, Kimberly Montero told HealthDataCon 2026. Her presentation offered a practical account of how faster analysis can help teams move from a broad disparity to a specific change in care.
Montero, MBA, eFACHDM, an administrative director for women’s health at Hartford Hospital and a data governor for Hartford HealthCare, presented “Driving Maternity Quality and Community Health Through Hyper-Agile Analytics” at the Oct. 15 conference. She described an approach that connects clinical outcomes, patient characteristics and social needs, then puts the resulting tools directly into clinicians’ hands.
“Traditional quality improvement is just too slow for the speed of human life or hospital life in the current age,” she said. Her concern was the delay between a clinical event and a team’s ability to understand it: decisions during labor occur in minutes, while reporting and improvement cycles can stretch across months.
The stakes remain substantial. CDC data show 649 U.S. maternal deaths in 2024, with a rate of 17.9 per 100,000 live births. The rate for Black women was 44.8, compared with 14.2 for White women. Those national figures establish the broader challenge; they do not measure the effect of Montero’s local work.
Give clinicians the means to ask the next question
Montero described replacing static reports with a connected dataset organized around four layers: quality outcomes, clinical care pathways, patient characteristics and social-needs screening. Electronic clinical quality measures validated within the EHR anchored the outcomes. Other layers supplied the variables clinicians wanted to examine, including diagnoses, induction methods, language, payer, geography and access to food or transportation.
The design allowed a question about an outcome to lead immediately to another question about the patients or care processes behind it. Instead of requesting an extract and waiting weeks, a nurse or physician could filter the dashboard, compare groups and investigate a possible explanation during the same inquiry.
Frontline staff helped shape the tools. When the dashboards became available through the EHR, Montero invited colleagues to explore them with a simple prompt: “What do you notice and what do you wonder?” Their questions generated further revisions, sometimes completed the same day. The speed she emphasized was the ability to investigate and iterate; the presentation did not establish a measured refresh interval for every underlying data source.
That participation also made the documentation behind each measure part of the conversation. Staff could recognize the fields they entered, understand the exclusions and challenge an interpretation. A shared view of the data gave clinical and administrative teams a starting point for deciding what deserved closer examination.
Read the cesarean rate with clinical context
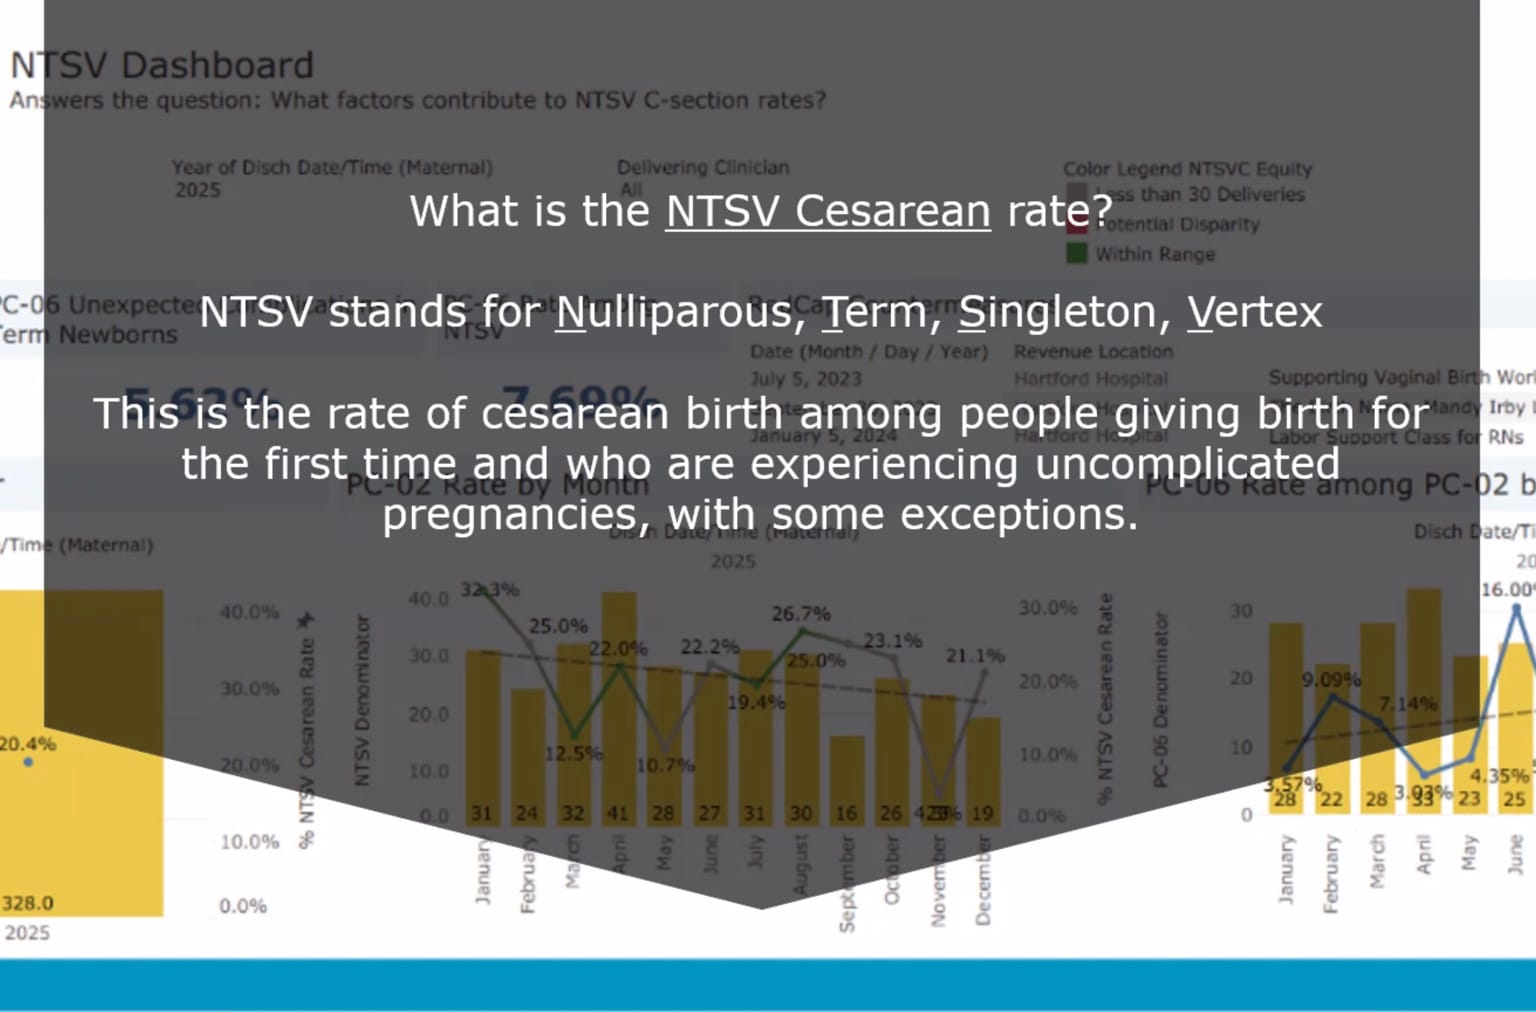
Her main example was the NTSV cesarean rate. The federal specification identifies nulliparous patients with a term, singleton baby in a vertex position: patients who have not previously given birth, carrying one baby at term, positioned head down. The category helps define a comparable population, but it does not establish that every pregnancy or labor is uncomplicated.
Montero said her institution’s goal was a rate at or below 25%, while emphasizing that cesarean delivery can be lifesaving. Lowering the rate therefore requires attention to maternal and newborn safety. The measure guidance pairs cesarean measurement with unexpected newborn complications as a balancing measure, helping teams watch for unintended consequences.
The dashboard used straightforward visual flags to direct inquiry. Groups with fewer than 30 patients were marked separately; larger groups could be highlighted when their rates exceeded the local comparison threshold. “Red doesn’t mean wrong at the onset,” Montero said. A flagged rate could have a valid clinical explanation. The colors prompted review rather than supplying a diagnosis of poor care or a formal test of statistical significance.
Turn a disparity into a specific response
In Montero’s account, an initially elevated cesarean rate among Black and African American patients led the team to examine additional characteristics. Filtering by language and geography narrowed its attention to Haitian-speaking families living near one facility. Further investigation identified a mismatch between patients’ language needs and the interpretation services being used.
That finding changed the response. “This isn’t fixed by implicit bias training alone,” she said. The team needed to address how staff selected language services, how families understood information during labor and whether education materials reflected their needs.
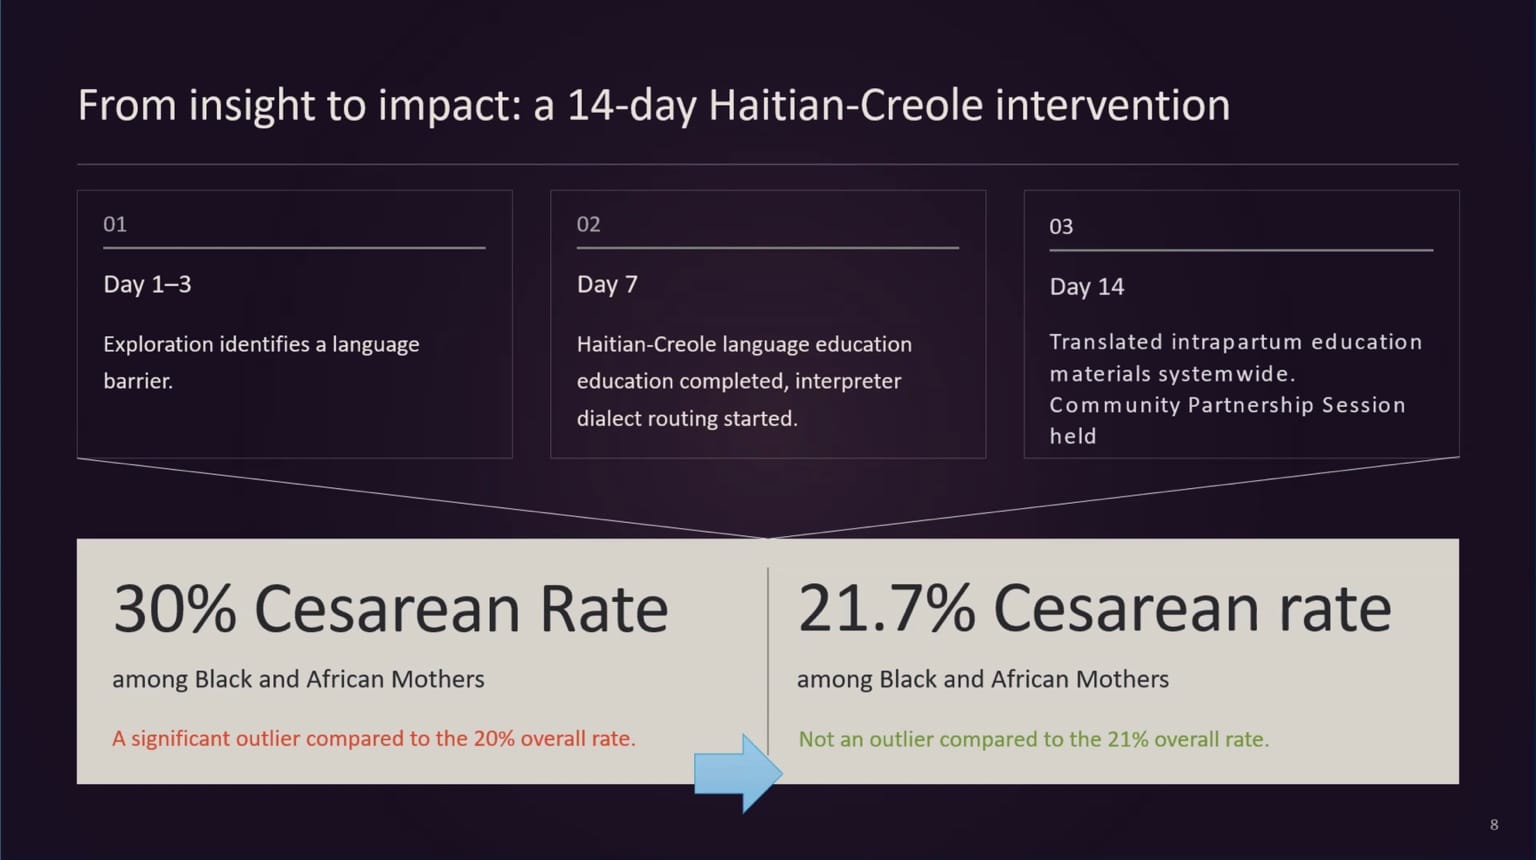
Within two weeks, Montero said, teams introduced language-selection protocols, translated labor education and birth-preference materials, and engaged a local Haitian community center in a listening session. The approach is consistent with federal CLAS standards, which call for competent language assistance, understandable materials and community participation in service design.
She reported that the cohort’s primary cesarean rate moved closer to the system baseline within one quarter and that unexpected newborn complications declined. However, she explicitly said the data displayed during the presentation had been randomized to protect privacy. The accompanying slide’s percentages are illustrative, not verified estimates of the intervention’s effect. The presentation did not supply the underlying counts or a controlled evaluation needed to establish the size or cause of the reported improvement.
Other questions led to broader changes in practice, Montero said. Teams examined opportunities to spend more time at the bedside, strengthen competencies for supporting patients with higher body mass index and standardize responses to fetal malposition through protocols and simulation. The dashboard supplied questions for clinical review; staff still had to design and carry out the work.
Carry the findings into community care
The same analytic approach brought social needs into quality discussions. Montero described associations between reported food insecurity, tobacco use or social isolation and adverse outcomes in the populations her team examined. Those findings gave leaders a basis for asking what support could be organized beyond the delivery unit.
The team used its analyses in conversations with hospital leaders, public officials and community organizations, and in business cases and grant requests. Montero described access to fresh produce and nutrition services for prenatal and postpartum patients, smoking-cessation support in clinics, and community health workers helping families connect with literacy resources, libraries and local support networks.
Hartford Hospital’s rooftop garden provides a concrete example of that community infrastructure. The hospital says the hydroponic garden opened in summer 2023 and supplies its Food4Health program. Its existence corroborates an available resource; it does not, by itself, demonstrate that the garden reduced cesareans or other complications.
Montero also identified work still ahead. Her team primarily used social needs reported by patients. Bringing external community datasets into the same analysis remained a further opportunity. Neighborhood information can illuminate access barriers, but linking an area’s characteristics to an individual patient’s outcome requires additional care and validation.
Measure change beyond the dashboard
Asked how to distinguish better reporting from better care, Montero emphasized following the affected patient group over time. “We are competing against ourselves,” she said. The aim was to see whether a specific population’s outcomes improved and whether a gap narrowed after the team acted.
For smaller organizations, she recommended starting with available tools and relevant measures. Her team used Tableau and EHR data, drawing questions from national findings and statewide maternal-health discussions. She urged colleagues to work with IT teams to validate measure definitions and connect the required discrete fields before relying on the results.
The transferable practice is a repeatable sequence: invite a clinical question, examine the relevant population, check the explanation with staff and patients, act, and assess what changed. That assessment must include newborn safety and the limits of small samples, alongside the outcome the team hopes to improve.
“Put them at the helm of data exploration,” Montero said of frontline clinicians. Her presentation’s strongest example showed what that invitation can produce: a question about an aggregate rate became a specific language-access intervention, with a team responsible for following its results.